Grays Harbor and Pacific County rates drop but tie for 2nd highest in the state

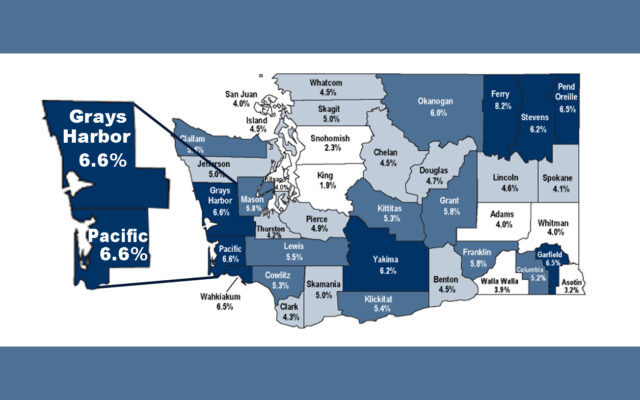
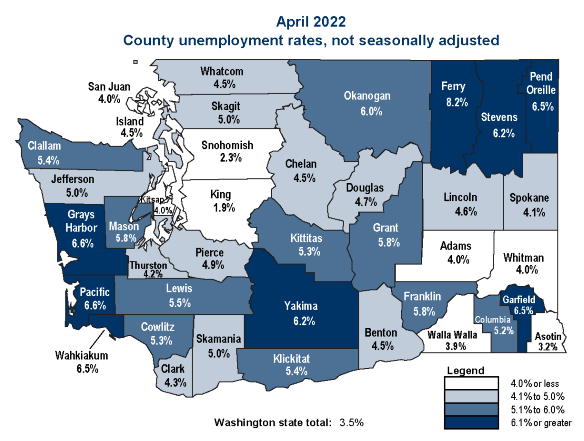
Grays Harbor, WA – Grays Harbor and Pacific County were tied for the second highest unemployment rate in the state, but both saw their unemployment rates drop.
According to the Employment Security Department’s non-seasonally adjusted numbers, only Ferry County at 8.2% had a higher unemployment rate in April than Grays Harbor and Pacific County at 6.6%.
Grays Harbor’s unemployment rate fell from 7.6% in March as did the total number of people on unemployment, but the labor force and total number of people employed dropped as well.
According to the Employment Security Department, there were 356 less people on unemployment in April than in March, but there were also 434 less people employed.
For Pacific County, their unemployment rate fell from 7.8%.
In April they had 123 less people on unemployment than in March, but they also had 120 less people employed.
When compared to the pre-pandemic levels of April of 2019, the unemployment rates for both counties are lower now and there are more people in the labor force.
For Grays Harbor the unemployment rate in April of 2019 was 7.4% compared to 6.6% in 2022 and there were 654 less people employed in 2019.
In Pacific County the unemployment rate in April of 2019 was 7.6% and there were 181 less people employed when compared to 2022.
| Grays Harbor | March 2022 | April 2022* | April 2021 | April 2019 |
| Labor Force | 30,127 | 29,337 | 28,482 | 28,872 |
| Total Employment | 27,836 | 27,402 | 26,214 | 26,748 |
| Total Unemployment | 2,291 | 1,935 | 2,268 | 2,124 |
| Unemployment Rate | 7.6% | 6.6% | 8.0% | 7.4% |
*Latest month non-seasonally adjusted
| Pacific County | March 2022 | April 2022* | April 2021 | April 2019 |
| Labor Force | 8,809 | 8,566 | 8,330 | 8,464 |
| Total Employment | 8,121 | 8,001 | 7,650 | 7,820 |
| Total Unemployment | 688 | 565 | 680 | 644 |
| Unemployment Rate | 7.8% | 6.6% | 8.2% | 7.6% |
*Latest month non-seasonally adjusted

You Might Also Like


